A robust monitoring and alerting strategy is a cornerstone of a successful DevOps workflow. It not only ensures system reliability and performance, it also enables teams to address issues proactively, before they reach end users.
A successful monitoring and alerting strategy combines the right tools, metrics, processes and automation, aligning with the DevOps objective of shipping high-quality software quickly.
But where do we begin?
Define achievable goals and metrics
Numerous tools are available to help scrape the resources we want to track. Without proper configuration, however, attempting to monitor everything results in an abundance of ineffective metrics. Let us start with the most common configurations and explore the tools best suited to these tasks.
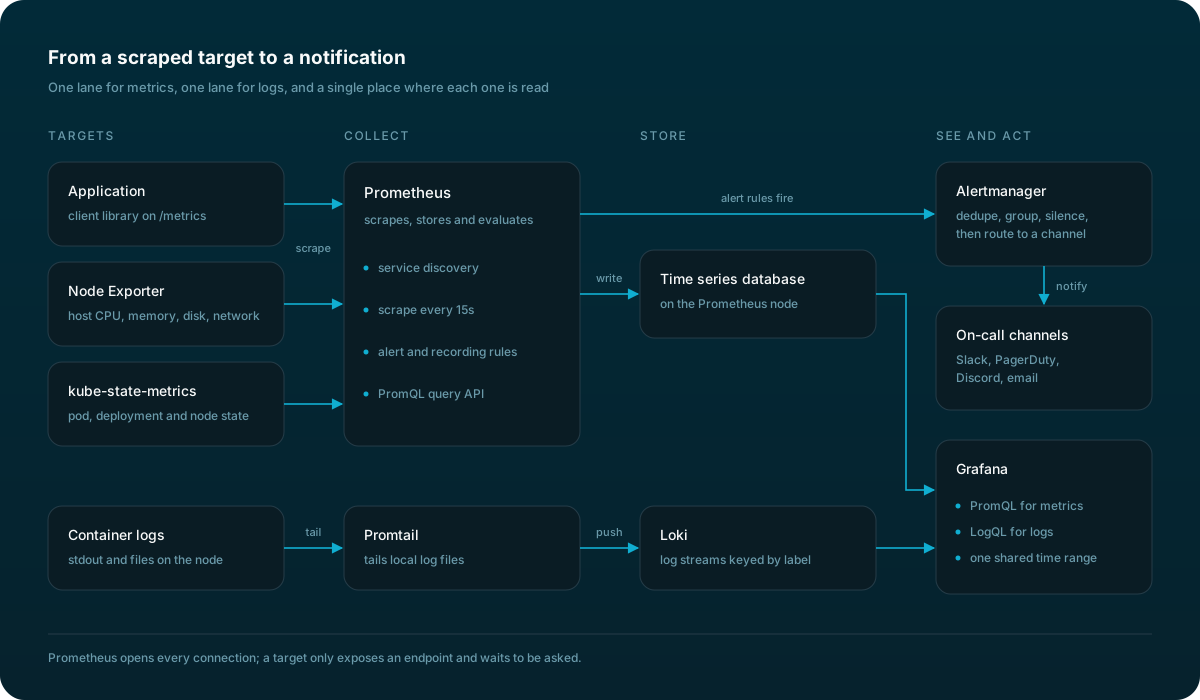
- To scrape logs, we need a solution that can observe the log destination and forward it to centralized storage. Loki paired with Promtail serves this purpose efficiently. Loki is designed for horizontal scalability, cost-effectiveness and easy setup, which makes it an ideal choice for aggregating and querying logs from various sources. Promtail, on the other hand, is an agent that ships the contents of local logs to a Loki instance, thus facilitating the log collection process.
- For container metrics, such as total restarts, CPU and memory usage and more, Prometheus is the go-to solution. It is particularly powerful for scraping and storing time-series data. When working with Docker containers, Prometheus can collect metrics directly from the Docker daemon. Additionally, in a Kubernetes environment, kube-state-metrics can be used alongside Prometheus. Kube-state-metrics listens to the Kubernetes API server and generates metrics about the state of the objects (such as deployments, nodes and pods), which can then be scraped by Prometheus for comprehensive monitoring.
- Regarding the underlying infrastructure, metrics related to the physical or virtual machines, such as CPU, memory, disk and network utilization, are crucial. This is where Node Exporter comes into play. Node Exporter is a Prometheus exporter that collects hardware and OS metrics exposed by *NIX kernels, allowing for detailed monitoring of system resources and performance. This tool is essential for gaining visibility into the operational health of the infrastructure supporting your applications.
The Prometheus ecosystem, of which Node Exporter is a part, supports a wide variety of exporters that can monitor different aspects of your systems, services and infrastructure. Each exporter is designed to fetch statistics from a specific source and present them in a format that Prometheus can scrape and store.
Visual data exploration with Grafana
Once all our resources have been scraped and metrics collected, we can turn our attention to the visualization and analysis phase, where tools like Grafana play a crucial role.
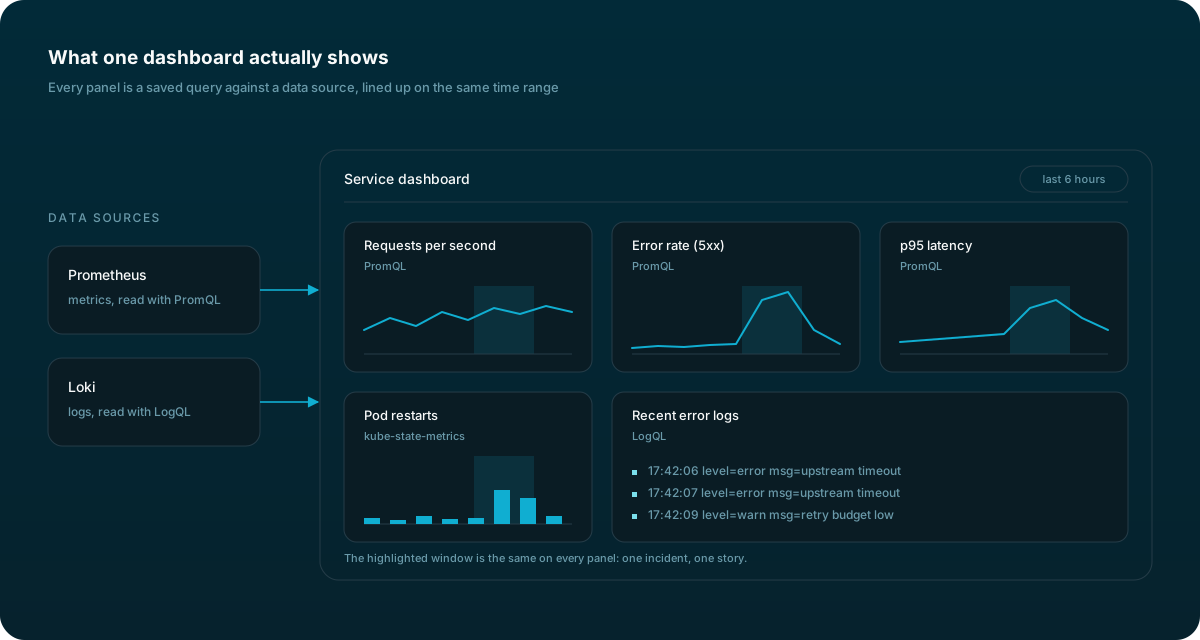
- Grafana enables us to create dynamic, insightful dashboards that bring our data to life.
Through its comprehensive support for various data sources such as Loki or Prometheus, Grafana allows us to aggregate and visualize metrics, logs and traces in a coherent and customizable interface.
Instant notifications with Alertmanager
Metrics collected, visualizations configured - and yet we cannot constantly watch Grafana, because the sheer volume of information is overwhelming.
Enter Alertmanager, a vital cog in the observability ecosystem, designed to streamline alert management.
It adeptly manages alerts generated by Prometheus, efficiently handling deduplication, grouping and routing, ensuring that notifications are both meaningful and manageable.
Alertmanager integrates with a wide array of notification platforms, such as:
- PagerDuty for on-call scheduling,
- Slack for team communication, and
- Discord for community engagement,
which ensures that alerts reach the right people through their preferred channels.